Some time ago I mentioned the phase difference between local temperature and insolation, trying to find the warmest day of the year in the given location (somewhere in here, http://climateaudit.org/2011/09/13/some-simple-questions/ cant locate the exact link now update: http://climateaudit.org/2011/09/28/monthly-centering-and-climate-sensitivity ). It is well known that the input to the system (solar insolation) peaks about one month before the output (local temperature). Being too lazy to read the relevant literature (ref 1-3 etc.) I built a simple recursive model for local temperature
[tex]t(k)=t(k-1)+As(t)-Bt(k-1)^4+Ct_2(k-1)^4[/tex],
where t is local temperature, s(t) insolation, t_2 temperature of a large mass nearby that location, k time index and A,B,C parameters that describe local conditions. This extra mass was needed to achieve satisfactory phase response, with similar equation:
[tex]t_2(k)=t_2(k-1)+Ds(t)-Et_2(k-1)^4+Ft(k-1)^4[/tex].
For solar data, I built a Matlab model of Earth-Sun system with orbital parameters from (4-6) and checked from nautical almanac (7) that the Sun position agrees with the model for year 2011. Basic checks to see if solar data is ok:
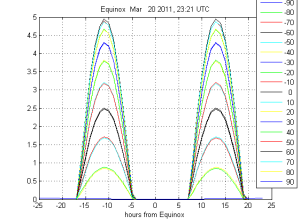
Figure 1. Insolation at Greenwich meridian during Mar 2011 Equinox, time from (4), (per latitude, time resolution 1 hour).
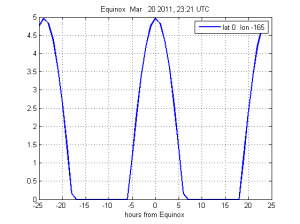
Figure 2. Insolation at 165 West longitude, 0 latitude, during Mar 2011 Equinox, time from (4), (time resolution 1 hour).
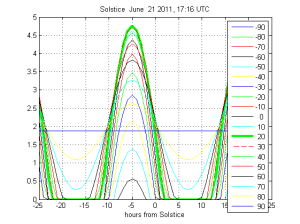
Figure 3. Insolation at Greenwich meridian during June 2011 Solstice, time from (4), (per latitude, time resolution 1 hour).
Finding the parameters was then just a minimization problem, using Jones 90 data as reference for the t(k). Jones data is monthly data so monthly means of t(k) were used for minimization. Result from one randomly picked station shown in the figures below.
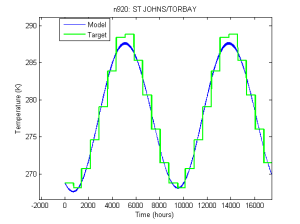
Fig 4. Model output versus measured temperatures
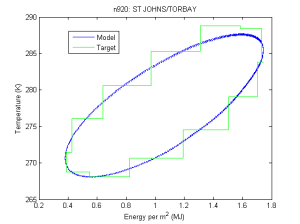
Fig 5. Insolation vs. temperature
Data in here : http://www.climateaudit.info/data/uc/modeldata920.txt
For some stations hourly temperatures are available (8). I took Windsor Ontario as an example:
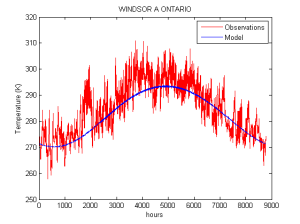
Fig 6. Windsor hourly temperature for 2012 vs. model
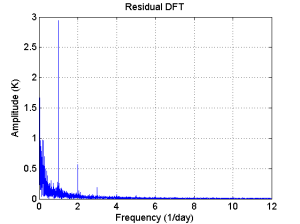
Fig 8. Windsor residual in frequency domain
Data in here: http://www.climateaudit.info/data/uc/WindsorData.txt
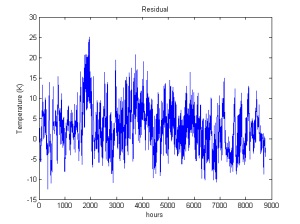
The mean of the residual is 2.6 C, and standard deviation 5.4 C. AR(1) lag-1 coefficient is 0.98, but local Whittle estimate for memory parameter d is 0.66 so one could say the residual represents some complex fractional stochastic process ( as weather often is convenient to describe, only in climatic scales miracles happen and neat AR1 processes only remain for GMT trend analysis (9)). Diurnal variation is clearly damped (see Fig. 8), so we just state that this model represents temperature 10 cm below ground or so ;)
Is this model useful? Don’t know yet. Next step would be to add white noise to s(t) and find out if the model can produce local time series with similar autocorrelation properties as real observations. Or see if changes in insolation agree with the results that physical climate models give. Or generate one Kalman filter for each station and see if they together can predict GMT anomaly. But the main reason was just to try to find one way to explain the phase differences, and that task was accomplished. There is quite a lot of parameters to fit, but if I leave constant part out (the model now works with Kelvins that agree with reality) I get similar results with an IIR filter that has 3 parameters per location.
1. Rohde et. al 2013, Appendix to Berkeley Earth Temperature Averaging Process:Details of Mathematical and Statistical Methods
2. North et. al, Differences between Seasonal and Mean Annual Energy Balance Model Calculations of Climate and Climate Sensitivity, Journal of the Atmospheric Sciences, 1979
3. Laskar et. al, A long-term numerical solution for the insolation quantities of the Earth, Astronomy and Astrophysics 2004
4. http://aa.usno.navy.mil/data/docs/EarthSeasons.php
5. http://aa.usno.navy.mil/faq/
6. http://nssdc.gsfc.nasa.gov/planetary/factsheet/earthfact.html
7. http://www.erikdeman.de/html/sail003a.htm
8. http://climate.weather.gc.ca/
9. http://climateaudit.org/2007/07/04/the-new-ipcc-test-for-long-term-persistence/
Leave a comment